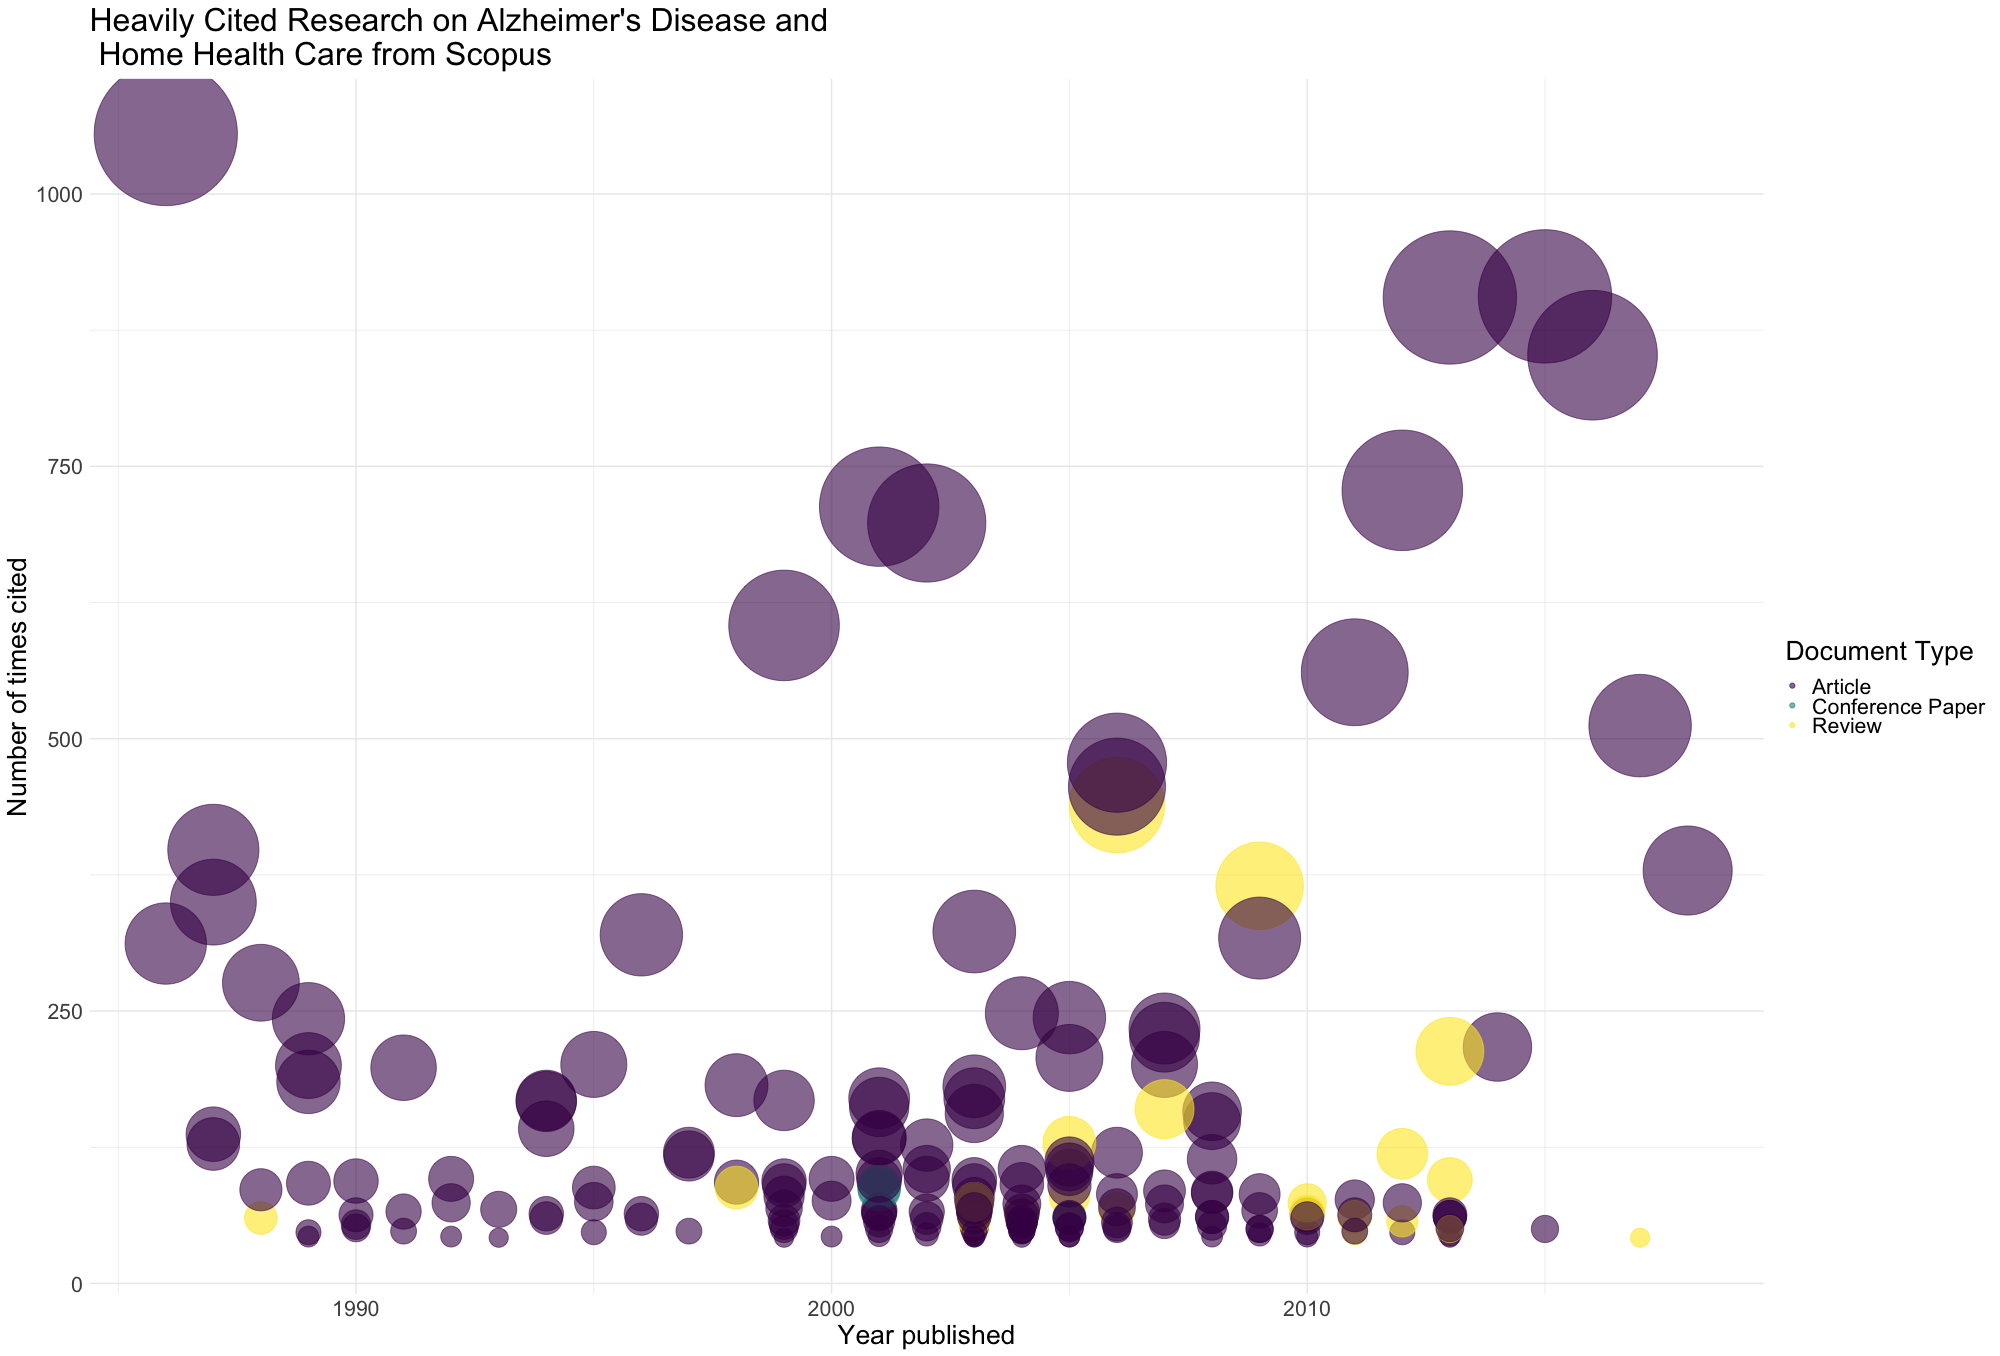
The bubble plot shown on this page (you may have also noticed it on the Medical Library’s digital signage and webpage banner), was created using ggplot2 in R. It shows publications related to Alzheimer’s Disease, Family Caregivers, and Home Health Care that has been cited more than 40 times by other research efforts.
Follow the link here to interact with this graph, and view more details about each of the publications represented in this visualization.
If you have any questions about this graph, please email medicaldata@yale.edu.